 Forex Stocks Crypto Trading Strategy Forex Strategies – Forex Resources – Forex Trading-free forex trading signals and FX Forecast

Learn a simple MACD, Zig Zag, and Moving Average crossover trading strategy for identifying buy and sell entries, confirming market structure, and managing risk with a trailing stop.
MACD, Zig Zag, and Moving Average Trading Strategy for Scalping
In this trading tutorial, we’ll break down a simple but powerful strategy that combines three popular indicators: Moving Average, Zig Zag, and MACD.
The goal of this strategy is to help you find higher-probability trade entries by combining trend direction, market structure, and momentum confirmation. It can be especially useful for scalping, particularly when paired with a smart trailing stop method.
This strategy is built around three main confirmations:
- Moving Average crossover to identify a potential trend change
- Zig Zag market structure to confirm whether the market is bullish or bearish
- MACD histogram confirmation to confirm momentum before entering the trade
As always, no trading strategy is perfect. Make sure you backtest this method and practice it on a demo account before using real money.
Indicator Setup
For this strategy, you will need the following indicators:
1. Moving Average

The Moving Average is used to identify the overall trend direction through a crossover signal. When the faster Moving Average crosses above the slower Moving Average, it suggests a potential bullish trend. When it crosses below, it suggests a potential bearish trend.
Use the Moving Average settings you have already tested or the settings that work best for your trading style.
2. Zig Zag Indicator

For the Zig Zag indicator, use the following settings:
- Depth: 3
- Deviation: 2
- Backstep: 1
The Zig Zag indicator helps identify swing highs and swing lows, making it easier to read market structure.
3. MACD Histogram

The MACD histogram is used as momentum confirmation. For buy trades, we want the MACD histogram to be above the zero line. For sell trades, we want it to be below the zero line.
Depending on your chart template, bullish MACD bars may appear as dark blue, while bearish MACD bars may appear as dark gray.
Buy Entry Strategy
Now let’s go step by step through the buy entry setup.
A buy setup happens when the market shows signs of shifting from bearish to bullish. However, we do not enter simply because the Moving Averages cross. We need confirmation from market structure and MACD momentum.
Step 1: Look for a Bullish Moving Average Crossover

The first signal you need is a bullish Moving Average crossover.
This happens when the faster Moving Average crosses above the slower Moving Average. This crossover tells us that the market may be changing direction from bearish to bullish.
At this stage, we do not enter immediately. The crossover is only the first clue. We still need to confirm that the market structure supports a buy trade.
Step 2: Confirm Bullish Market Structure with Zig Zag
After the bullish Moving Average crossover appears, check the Zig Zag indicator.
For a valid buy setup, the Zig Zag should show a bullish market structure. That means the market should be forming:
- Higher Highs
- Higher Lows
This is important because market structure is part of price action analysis. A bullish trend is not only about indicators crossing. The price itself must also show that buyers are gaining control.
Sometimes, the market may already form a Higher High and Higher Low before the Moving Average crossover happens. If that is the case, you do not need to force an entry right away. Instead, wait for the next valid Higher Low to form after the crossover.
A potential Higher Low is forming when:
- The Zig Zag creates a downward leg, but the price does not break below the previous low.
- The price then shows a bullish price action signal, such as a bullish engulfing candle.

This tells us that the pullback may be ending and the bullish trend may continue.
Step 3: Confirm Momentum with the MACD Histogram
Once the Moving Average crossover and bullish Zig Zag structure are in place, check the MACD histogram.
For a buy entry, the MACD histogram should be:
- Above the zero line
- Showing bullish momentum
- Colored dark blue, if your MACD template uses that color

This MACD confirmation helps filter out weaker setups. It tells us that momentum is supporting the bullish move.
Step 4: Enter the Buy Trade
After all three confirmations are present, you can consider entering a buy trade.
The buy entry is taken at the opening of the next candle after the signal is confirmed.
Your stop loss should be placed below the nearest swing low. This swing low is usually the most recent Higher Low shown by the Zig Zag indicator.

Buy Entry Checklist
Before entering a buy trade, make sure you have:
- Bullish Moving Average crossover
- Zig Zag forming Higher Highs and Higher Lows
- A new Higher Low after the crossover
- Bullish price action, such as a bullish engulfing candle
- MACD histogram above the zero line
- Stop loss below the nearest swing low
Sell Entry Strategy
Now let’s look at the sell entry setup.
A sell setup is basically the opposite of a buy setup. We are looking for signs that the market is changing from bullish to bearish.
Again, we do not enter only because the Moving Averages cross. We need confirmation from bearish market structure and MACD momentum.
Step 1: Look for a Bearish Moving Average Crossover
The first signal for a sell setup is a bearish Moving Average crossover.
This happens when the faster Moving Average crosses below the slower Moving Average. This suggests that the market may be shifting from bullish to bearish.
Once this crossover appears, the Moving Average is telling us that bearish pressure may be taking over. But before entering a sell trade, we need to confirm the market structure.
Step 2: Confirm Bearish Market Structure with Zig Zag
For a valid sell setup, the Zig Zag indicator should show a bearish structure. That means the market should be forming:
- Lower Highs
- Lower Lows
This confirms that sellers are in control and the market is moving in a bearish direction.
If the market has already formed a Lower High before the Moving Average crossover, wait for the next bearish structure confirmation after the crossover. Ideally, you want to see price reject a pullback and continue lower.
A good bearish setup usually appears when:
- The Zig Zag shows a pullback that fails to break above the previous high.
- Price forms bearish price action, such as a bearish engulfing candle.
- The market begins pushing toward a new Lower Low.
This gives you a cleaner sell setup because you are trading in line with the bearish structure.
Step 3: Confirm Momentum with the MACD Histogram
The third confirmation is the MACD histogram.
For a sell entry, the MACD histogram should be:
- Below the zero line
- Showing bearish momentum
- Colored dark gray, if your MACD template uses that color
This confirms that momentum is moving in the same direction as your sell setup.
Step 4: Enter the Sell Trade
Once all confirmations are complete, you can consider entering a sell trade at the opening of the next candle.
Your stop loss should be placed above the nearest swing high. This is usually the most recent Lower High formed by the Zig Zag indicator.
Sell Entry Checklist
Before entering a sell trade, make sure you have:
- Bearish Moving Average crossover
- Zig Zag forming Lower Highs and Lower Lows
- Bearish price action after a pullback
- MACD histogram below the zero line
- Entry at the next candle open
- Stop loss above the nearest swing high
Using a Trailing Stop for Scalping
This strategy can become even more effective for scalping when you use a trailing stop.
Because scalping focuses on quick trades, you do not always want to wait for a large target. Instead, you can trail your stop loss as the trade moves in your favor.
For buy trades, you can trail the stop below each new Higher Low.
For sell trades, you can trail the stop above each new Lower High.
This allows you to protect profit while still giving the trade room to continue.
Final Thoughts
The strength of this MACD, Zig Zag, and Moving Average trading strategy comes from using multiple confirmations instead of relying on one indicator alone.
The Moving Average crossover helps identify the possible trend change. The Zig Zag indicator confirms market structure. The MACD histogram confirms momentum. When all three signals line up, the trade setup becomes much stronger.
To summarize:
- Use the Moving Average crossover to identify trend direction.
- Use the Zig Zag indicator to confirm market structure.
- Use the MACD histogram to confirm momentum.
- Enter on the next candle after confirmation.
- Place your stop loss near the closest swing point.
- Use a trailing stop when scalping to protect profits.
Before using this strategy in live trading, always backtest it, practice on a demo account, and apply proper risk management. Trading involves risk, and no strategy can guarantee profits.
“NEW DONCHIAN CHANNEL” Trading

High Accuracy Forex Donchian Channel Trading Strategy with Super Signals Channel Indicator. Donchian Channels has a simple plotting of highest high and lowest low of the last “n” periods.
The n periods is based on the trader’s choice, who can select the period according to their requirements ranging from a day, hour and minutes etc.
Read: High Accuracy Forex Simple Momentum Stochastic Oscillator Trading System
Traders use Donchian Channels to understand the support and resistance levels.
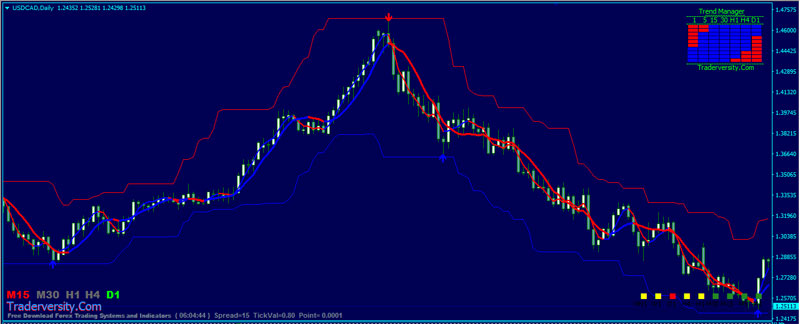
How to trade the market with Donchian Channel Trading Strategy with Super Signals Channel Indicator?…
Super Signals Channel Indicator is the main key in this trading system but we can’t use the indicator alone. We need confirmation indicators to catch high portability signals.
- Best Time Frames: M30, H1, H4, and Daily time frames
- Recommended Currency Pairs: EURUSD, GBPUSD, USDJPY, and all major pairs
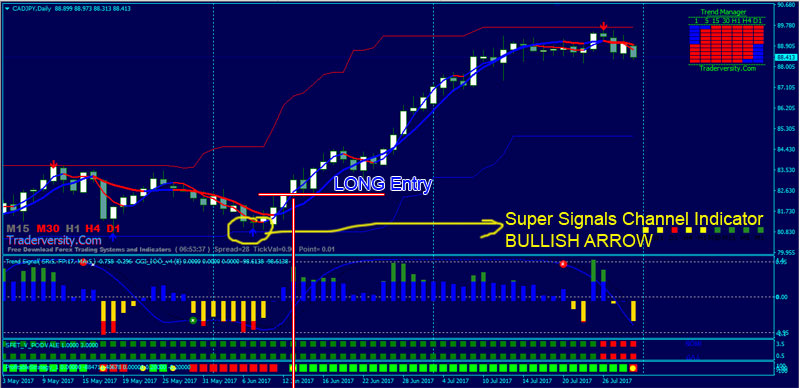
- Blue color BULLISH ARROW Super Signals Channel Indicator
- Non-Lag 10 MA Blue color and above Blue color Non-Lag 21 MA
- Trend Signal oscillator upward
- CCI NUF Blue color bars
- SFET V PODVALE Green color
- Profitable Strategy 1 Green Color
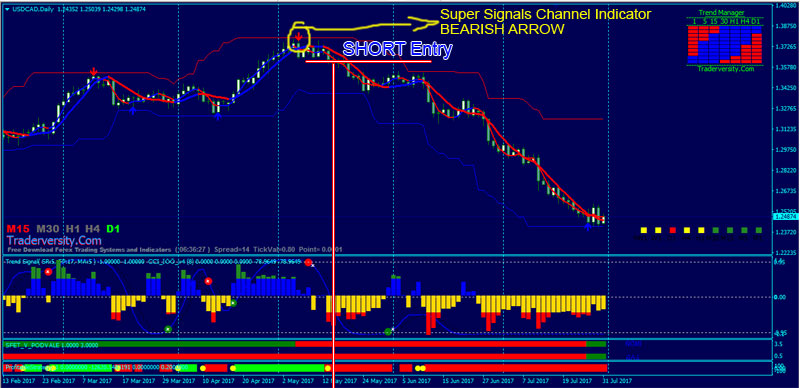
- Red color BEARISH ARROW Super Signals Channel Indicator
- Non-Lag 10 MA Red color and below Red color Non-Lag 21 MA
- Trend Signal oscillator downward
- CCI NUF Red color bars
- SFET V PODVALE Red color
- Profitable Strategy 1 Red Color
Placing stop loss is easy: Just Place your stops outside of the channel lines. But your stop loss should be determined by the timeframe you are trading in.
- If you are trading on 5-minute charts, place your stop loss 10-15pips outside of the channel line.
- If you are trading in 1hr or 4 hr charts, you stop loss should be 20-50pips outside of the channel line.
HOW DO YOU SET YOU TAKE PROFIT TARGETS?….
Set your take profits to 3 times the amount your risked: for example, if you stop loss is 20 pips then set your take profit target to 60pips.
If you’re looking for a low-risk trading strategy that works across the forex, stock, and even crypto markets, the combination of Bollinger Bands and RSI Trendline Breaks is one of the most effective techniques you can learn. Whether you’re a scalper, day trader, or swing trader, this strategy helps you identify high-probability trading opportunities while keeping risk under control.

When seeking to open buy positions, observe indicator readings as follows:
- 1st. Prices falling within a trading range.
- 2nd. While the price must tag the lower Bollinger Bands.
- 3rd. Wait for a bar that closes higher than open.
- 4th. Open BUY will only be done if the RSI Oscillator breaks the downtrend line above the the 30 levels as an oversold signal.
- Place a stop loss below the lower band line.
- Target profit on the Middle band is much safer, but you may try target profit when the price approaches the upper band line.
- Pay attention to the candlestick pattern, if there is a strong indication of trend continuation, be patient and wait for a reversal signal even if the RSI value is below the 30 levels. That is a sign that the market is being filled with sellers. So it is quite dangerous if open BUY is in a strong downtrend

When seeking to open sell positions, observe indicator readings as follows:
- 1st. Prices rising within a trading range.
- 2nd. Price must tag the upper Bollinger Band.
- 3rd. Wait for a bar that closes lower than open.
- 4th. Open SELL will only be done if the RSI Oscillator breaks the uptrend line below the the 70 levels as an overbought signal.
- Place a stop loss above the upper band line.
- Target profit on the Middle band is much safer, but you may try target profit when the price approaches the lower band line.
- Pay attention to the candlestick pattern, if there is a strong indication of trend continuation, be patient and wait for a reversal signal even if the RSI value is above the 70 levels. That is a sign that the market is being filled with buyers. So it is quite dangerous if open SELL is in a strong uptrend.
The Powerful RSI Leading Signal Strategy Every Scalper and Swing Trader Should Know
The Relative Strength Index (RSI) has earned its reputation as one of the most trusted momentum indicators in technical analysis. From forex traders to stock market investors, thousands of traders rely on the RSI every day to identify trend strength, spot potential reversals, and uncover high-probability trading opportunities.
Despite its popularity, the RSI is also one of the most misunderstood indicators—especially among beginners.
Many new traders believe that simply buying when the RSI is oversold or selling when it’s overbought is enough to generate consistent profits. While this approach may occasionally work, it often leads to false signals and unnecessary losses because it overlooks the most important aspect of the RSI: market momentum.

The truth is, the RSI becomes significantly more powerful when you understand how to interpret its behavior instead of relying on basic overbought and oversold readings alone.
When used correctly, the RSI can reveal whether a trend is strengthening or weakening, identify shifts in market momentum before they become obvious on the price chart, and help traders find more precise entry and exit points. This deeper understanding allows you to trade with greater confidence while avoiding many of the mistakes that trap inexperienced traders.

In this bullish chart, we see the price moving above the 200-period S-M-A. This means that all traders, whether retail traders, big traders, or institutional traders, agree that the market is in a bullish trend.
Here, we find a valid RSI trend line. It provides additional visual confirmation that a trading opportunity is approaching. Using the RSI trend line breakout gives a buy signal a few candles before the actual movement.
After the RSI trend line breakout occurs, you should enter the market immediately by opening a BUY position here and setting the Stop Loss below the nearest swing low.

In another chart, we can see how a short setup would look like.
In this case, we have the price moving down below the 200-period S-M-A, which means that all traders, retail, big, or institutional, agree that the market is in a bearish trend, making it a valid bearish trend.
We add a trend line on the RSI indicator when the price is moving against the main trend. As we discussed earlier, this is a valid RSI trend line and not forced. Then we identify the RSI trend line breakout in the SELL direction.
Next, we will open a SELL position here, placing the Stop Loss above the nearest swing high. The price continues its bearish trend, allowing us to gain a decent profit compared to the risk we set.
Even though 14 is the default period, that may not make it the best setting for your trading. Normally short-term traders use a S-M-Aller period, such as a 8 period RSI, to replicate shorter term movements in the market. Longer-term traders may opt for a higher period, such as a 20 period RSI or even 50. Depending on your trading style, you can lower your RSI to increase sensitivity or you could raise it to decrease sensitivity.
 Forex Market Hours and Trading Zone Indicator
 ZZZ (ZigZag) Indicator
 Double Buzzer RSI TC Strength of Momentum Trading
 50-period EMA Trading with Market Profile Filter
 WallStreet Forex Robot: THE BEST, SECURE & MOST POWERFUL Forex Trading ROBOT
 Extremely High Accuracy Accelerator Oscillator Trading Strategy with Price Borders
 Trend Following Trading with FGM RSI Profitable Strategy
 Forex EMA Fisher Trading System
 HMA Golden Finger System: Simple High Accuracy Forex & Stocks MT4 Trading Strategy and Indicators
 Forex Linear Regression MQ4 Trading Indicator and Strategy


