 Forex Stocks Crypto Trading Strategy Forex Strategies – Forex Resources – Forex Trading-free forex trading signals and FX Forecast

How To Trade and Identify Trend Reversal Patterns EASILY with Forex RSI Trend Reversal Trading Strategy For 1H 4H and Daily TimeFrames. Just like determining a direction of a trend, trend reversals in Forex market are always determined and confirmed from a larger timeframe.
The “RSI Trend Reversal Trading Strategy” identifies possible price reversal patterns.
Blue dots TheSecret Trend Reversal Indicator with downward RSI line suggest a bullish reversal pattern while, on the other hand, red dots TheSecret Trend Reversal Indicator with upward RSI line suggest a bearish reversal pattern.
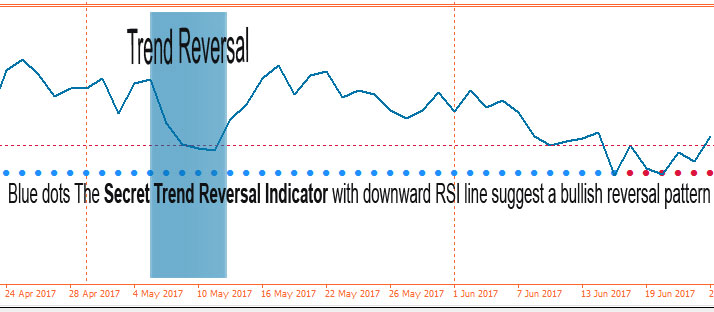
Red and green TheSecret Trend Reversal Indicator dots may appear in both up and down trends. So, we need to filter out most bad signals with an additional trading indicator.
This can be done with 50 EMA (Exponential Moving Average) or RSI indicator determined and confirmed from a larger timeframe.
Let’s examine How To Trade and Identify Trend Reversal Patterns with High Accuracy Forex RSI Trend Reversal Trading Strategy.
How to identifying forex trend reversals with EMA Indicator. The most common use moving averages are 50, 100, or 200. Generally, two MAs per chart are enough, but depending on a strategy more or fewer could be used.
We need to look at three important aspects when analyzing a security using moving averages;
- Their crossover,
- Slope,
- and Price position relative to the EMAs.
Taking an example of 50 and 100 EMAs, a crossover of the two MAs could be seen as a BULLISH or BEARISH sign.
While for 50 and 100 SMA combination, the slope would be more important with primer indicating shorter term momentum and later projecting longer-term momentum.
- Best Time Frames: 1H, 4H, and Daily
- Recommended Currency Pairs: EURUSD, GBPUSD, USDJPY,… all Major Pairs
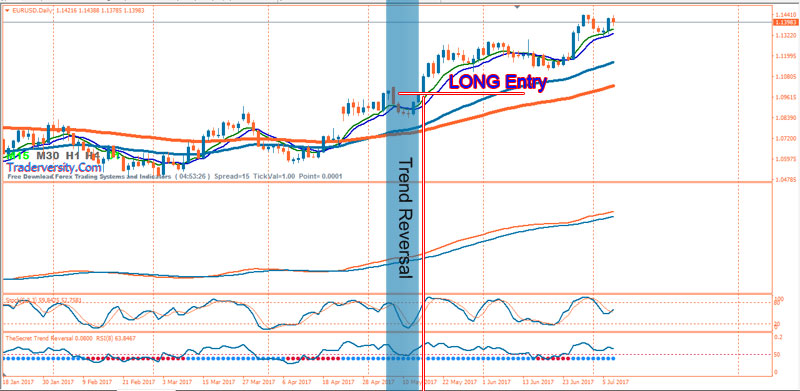
- 50 EMA upward and above upward 100 EMA
- SFX MCL indicator lines upward (green color line above blue color line)
- StochasticOscillator upward
- TheSecret Trend Reversal Indicator blue color dots
- RSI line upward above 50 level
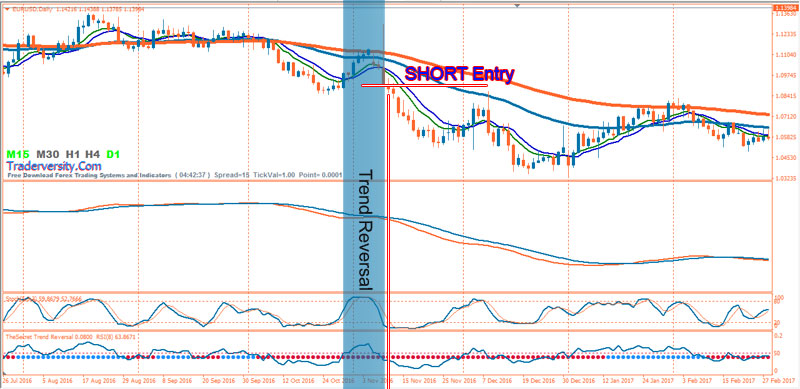
- 50 EMA upward and above upward 100 EMA
- SFX MCL indicator lines upward (green color line above blue color line)
- StochasticOscillator upward
- TheSecret Trend Reversal Indicator blue color dots
- RSI line upward above 50 level
For best results, use candlestick patterns in conjunction with other analysis tools such as Forex High and Low Trading, Support and Resistance, Trend Lines, technical indicators, Fibonacci Retracements, Chart Patterns,…etc.
 Top 7 High Accuracy EURO & LONDON Session Trading Systems
 Forex Market Session MT4 Trading Indicator and Template
 SFET Podvale Gold Bands Trading with Trends Signal and CCI Nuf Filter
 Forex High/Low MACD Channel “INTRADAY & SCALPING” Trading Strategy
 SEFA Bull-Bear Statics and Dynamics Support Resistance Trading
 Forex & Stocks HH-LL Trend Reversal System
 TOP 3 Heiken Ashi Trading Indicator and Strategy
 Intraday Trading | H1 Time Frame Forex Profit Launcher Trading System
 Trend Session MACD Double Histogram Trading System with Parabolic Indicator
 Bollinger Bands Reversal Trading Strategy with RSI and CCI FIlter


