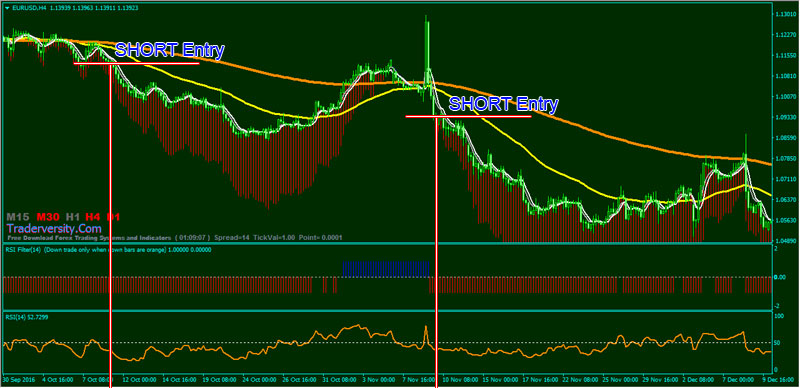
The most common Moving Average periods for Currency Traders at Banks – I will show you The Best and Most Popular EMA Exponential Moving Average Strategy for GBPUSD and EURUSD Day Trading in Forex.
The 50 Day Moving Average is a market price average over the last 50 days which often acts as a support or resistance level for trading.
The moving average will trail the price by its very nature.
As prices are moving up, the moving average will be below the price, and when prices are moving down the moving average will be above the current price.
If the short-term (50 days) Moving Average breaks above the long-term (200 Day) Moving Average, this is known as a Golden Cross, whereas the inverse is known as a Death Cross.

As long-term indicators carry more weight, the Golden Cross may indicate a bull market on the horizon and is usually reinforced by high trading volumes.
The last use to be discussed is the 50 and 200-day moving average crossover. The concept is simple;
- When the 50-day Moving Average crosses above the 200-day Moving Average it is considered a BUY signal.
- If the 50-day Moving Average crosses below the 200-day Moving Average it is considered a SELL signal.
This is a longer-term strategy that will keep you in the market during rallies, even when the price does the inevitable retrace but will get you out quickly if the correction becomes more serious.
An investor does need to be careful of whipsaw markets, with this strategy, where price is moving sideways instead of in a defined trend.

- The 50-day Moving Average crosses above the 200-day Moving Average (GOLDEN CROSS)
- Trend Manager Blue color above the candles
- RSI Filter Blue color bars
- RSI(14) line upward above 50 level
- Mint Signal Green color

- The 50-day Moving Average crosses below the 200-day Moving Average (DEATH CROSS)
- Trend Manager Red color below the candles
- RSI Filter Red color bars
- RSI(14) line downward below 50 level
- Mint Signal Red color
The trading system works well for EURUSD and GBPUSD pairs. The most recommended time frames are 1H, 4H, and Daily.
Moving averages can be used in a number of ways, and with a variety of timeframes. Many traders use multiple moving averages, each with a different timeframe, to generate BUY and SELL signals. Read: How To Trade and Identify Trend Reversal Patterns.
There is no perfect or ideal way to use moving average lines, nor an ideal time frame used in their calculation. But, for traders using daily charts, the 10-day, 20-day, 50-day, 100-day, and 200-day moving averages tend to be preferred settings…. either each by
But, for traders using daily charts, the 10-day, 20-day, 50-day, 100-day, and 200-day moving averages tend to be preferred settings…. either each by themselves or combinations of those lines all applied simultaneously.
 Forex Stocks Crypto Trading Strategy Forex Strategies – Forex Resources – Forex Trading-free forex trading signals and FX Forecast


![High Accuracy Forex Heiken Ashi SEFC BBand Stop Alert MT4 Trading System [7686]](https://traderversity.com/wp-content/uploads/2020/01/Forex-Heiken-Ahi-SEFC-BBand-Stop-Alert-Featured-150x150.jpg)


