Best Forex High and Low Trading Strategy with EMA RSI Stochastic MACD Indicators. The “High-Low EMA RSI Stochastic and MACD Trading Strategy” Is A Really Simple System That Anybody Can Use.
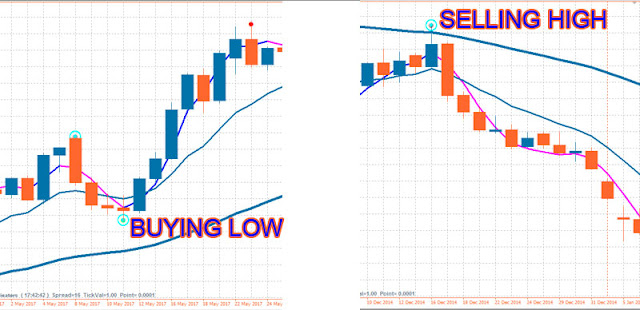
With this “High-Low EMA RSI Stochastic and MACD strategy” you are trading with the trend and are hopefully Buying Low, Selling High, and at times catching a major move in the market carrying you into a very large swing trade.
EMA (ExponentialMoving Average) is one very popular Forex indicator used by lots of traders and is used to determine the main underlying trend regardless of any corrective move in the price action.

Here’s what you need to know about the EMA: [1] When a price is below the EMA, that’s a downtrend. [2] When a price is above the EMA, that’s an uptrend
Remember that there will be a different trend on each time frame and it is perfectly acceptable to have a downtrend on a 4-hour chart and an uptrend on the daily chart. Read High Profits Support Resistance BreakOut Trading Strategy.
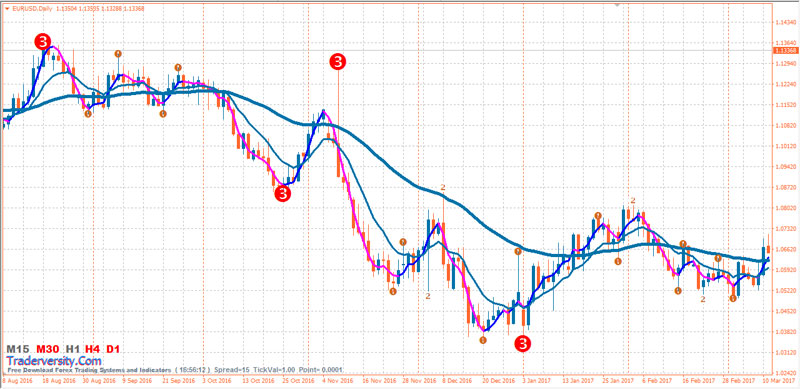
It is a simple indicator that places semaphore points on the maximum and minimum of a higher, medium and lower period.

This Forex SEMAFOR Trading Indicator absolutely REPAINTS however used in conjunction with RSI or Stochastics or MACD it can give you the degree of the reversal.
If stochastics are breaking and the Semafor is painting a 3 that’s your best Risk to reward. Do not pick tops or bottoms. It will burn you every time. Trade 2’s and 3’s only never 1’s.
Here are the 6 steps to trading this “Forex High and Low Trading with EMA RSI Stochastic and MACD Indicator” strategy.
- Place the Trading System on the daily chart of your Forex pair. See if it’s an uptrend or a downtrend. The daily chart determines the main trend.
- Switch to the 4 hr chart and see where the Trading System is relative to the price, is it in the same trend as the daily chart.
- If yes, switch to the 1 hr chart and check if the 1 hr chart is in the same trend as the daily and the 4 hr charts.
- It is in the 1 hr chart where your trade entries are executed when the trend on the 1 hr chart is the same as the 4 hr and the daily charts.
- Considering 123 Semafor number 2 or 3 circles, what we want to do here is to “buy the dips” and “sell the rallies” in the 1 hr time frame.

- 123 Semafor number 2 or 3 circle below the price (it’s a BUYING LOW signal)
- Price upward above EMA and NonLag MA line
- 10 EMA upward above 50 EMA line
- NonLag MA blue color line above 10 EMA and 50 EMA lines
- Stochastic upward
- RSI upward above 50 level
- MACD histogram upward above 0 level

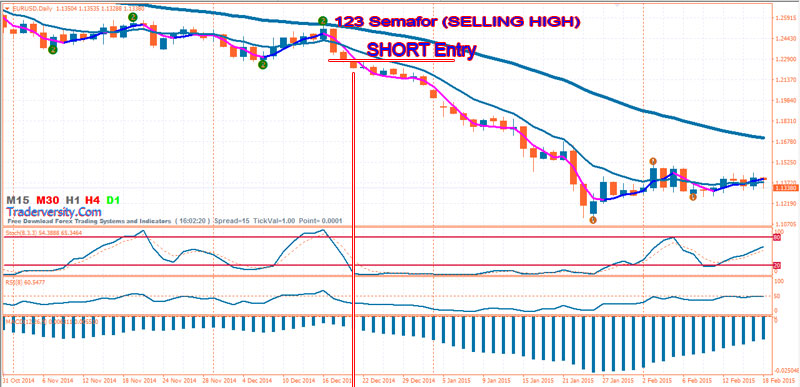
- 123 Semafor number 2 or 3 circle below the price (it’s a SELLING HIGH signal)
- Price downward below EMA and NonLag MA line
- 10 EMA downward below 50 EMA line
- NonLag MA magenta color line below 10 EMA and 50 EMA lines
- Stochastic downward
- RSI downward below 50 level
- MACD histogram downward below 0 level
Every trading method will have times where not everything is running according to your plan. With this trading strategy, there are 2 issues that are quite common. Dealing with them is quite simple though.
- What happens if the 1 hr trend is different from the 4 hr and the daily time frames?
- Wait until 1 hr trend is the same as the 4hr and the daily chart.
- What happens if the 4 hr and the 1 hr trend are the same and the daily is different?
- Every time frame has to match and have the same trend. If one time frame is different, you wait until all are the same trend. This can take a while so be patient!
 Forex Stocks Crypto Trading Strategy Forex Strategies – Forex Resources – Forex Trading-free forex trading signals and FX Forecast


