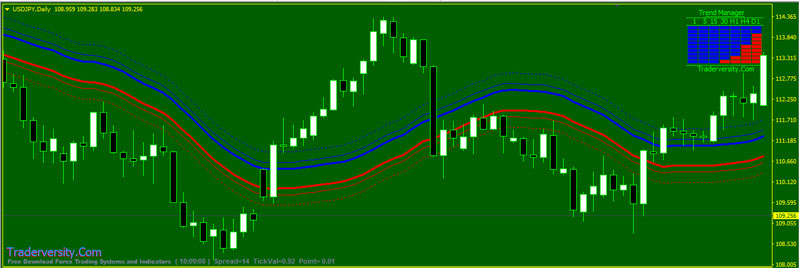
High Accuracy Daily Time Frames Forex NonLag MA Envelopes and Momentum Trading Strategy. Moving average envelopes use closing prices, which makes them useful for seeing period-to-period price action but less useful for intraday trading.

- DOWNLOAD these NON-REPAINT Tools For Making The Perfect Trade Entry (the best trading tools all traders MUST HAVE)
- Use a demo account or a small live account first to practice this trading system
Does the Moving Average Envelopes forex indicator sound familiar to you?… If not, Moving Average Envelopes consist of a moving average plus and minus a certain user defined percentage deviation.
Moving Average Envelopes claim to be an indicator of overbought or oversold conditions, visual representations of price trend, and an indicator of price breakouts.
The inputs of the Moving Average Envelopes indicator is shared below:
- Moving Average: A simple moving average of both the highs and the lows. (generally 20-period, but varies among technical analysts; also, a person could use only the close when calculating the moving average, rather than two)
- Upper Band: The moving average of the highs plus a user defined percentage increase (usually between 1 & 10%).
- Lower Band: The moving average of the lows minus a user defined percentage (again, usually between 1 & 10%).

In this trading system we use Moving Average Envelope as trend indicator on DAILY Time Frame.
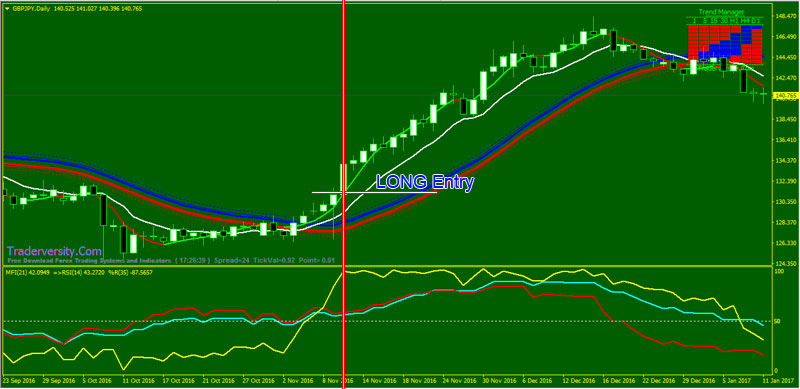
- When prices breaking above the upper envelope, we view that as a BUY (LONG Entry) opportunity.
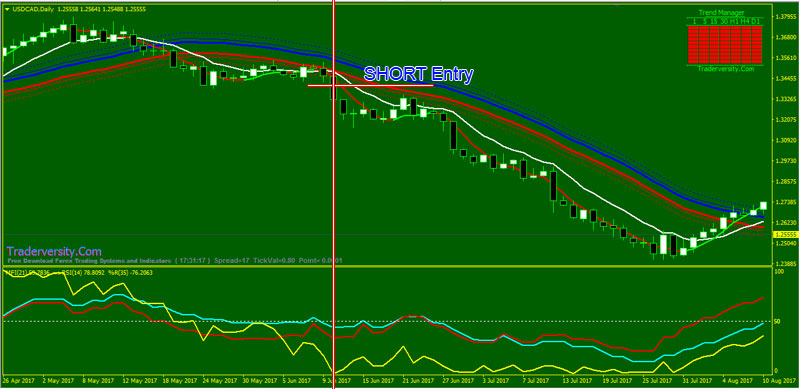
- And when prices break below the lower envelope, we view that as a SELLING (SHORT Entry) opportunity.

- Prices breaking above the upper envelope
- RSI line upward and above 50 level
- MFI line upward and above 50 level
- WPR line upward and above 50 level
- NonLag MA Green color and above MA Envelopes

- Prices breaking below the lower envelope
- RSI line downward and below 50 level
- MFI line downward and below 50 level
- WPR line downward and below 50 level
- NonLag MA Red color and below MA Envelopes
Moving Average Envelope is a very simple and easy to understand as trend indicator on DAILY Time Frame.
A new trend in price is usually indicated by a price breakout as outlined above with a continued price close above the upper band, for an upward price trend.
A continued price close below the lower band might indicate a new downward price trend.
This Daily Time Frame Forex NonLag MA Envelopes and Momentum Trading Strategy is extremely high accuracy if you discipline with the rules.
 Forex Stocks Crypto Trading Strategy Forex Strategies – Forex Resources – Forex Trading-free forex trading signals and FX Forecast


