FREE DOWNLOAD The Best and Most Successful Forex Slope Direction Line Trading System and Strategy. If you’ve been involved with Forex for more than a few days, I’m sure you’ve heard the sayings: “the trend is your friend” and “trade with the trend”.

- DOWNLOAD these NON-REPAINT Tools For Making The Perfect Trade Entry (the best trading tools all traders MUST HAVE)
- Use a demo account or a small live account first to practice this trading system
There are a million and one trading strategies out there, and most of them can be profitable when traded correctly.
However, it is universally accepted that trend following strategies are by far and away the most profitable strategies available.
Slope Direction Line is the trend indicator drawn on the basis of Moving Average.
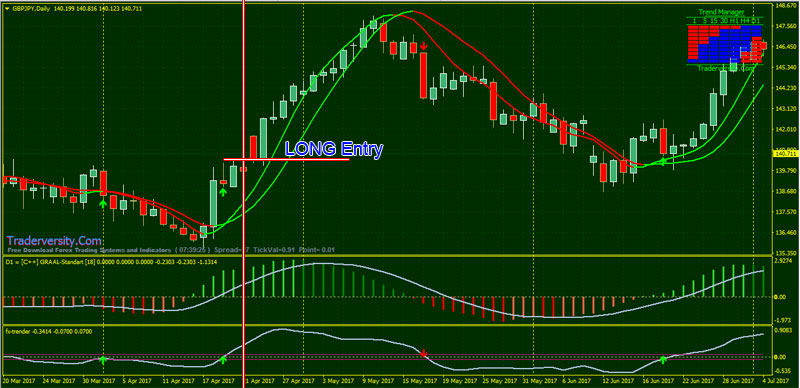
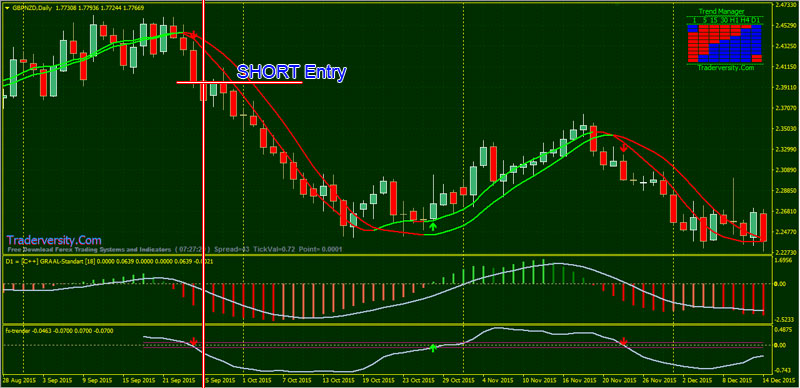
Trade decisions are taken according to the position of the indicator line in relation to price and its color change. Red color for SELL and Green color for BUY. Very simple and easy to understand as explained on the illustration below:

Slope Direction Line Default Input Parameters:
- Period = 30 — The indicator period for the subsequent moving average calculations.
- MA_Method = 3 — Averaging method. Can be any of the Moving Average methods
- Applied_Price = 0 — Used price. Can be any of price constants: 0 — CLOSE, 1 — OPEN, 2 — HIGH, 3 — LOW, 4 — MEDIAN ((high+low)/2), 5 — TYPICAL ((high+low+close)/3), 6 — WEIGHTED ((high+low+close+close)/4).
Slope Direction Line provides an opportunity to detect various peculiarities and patterns in price dynamics which are invisible to the naked eye.
Based on this information, traders can assume further price movement and adjust their strategy accordingly.
The “Forex Slope Direction Line Trend Following Trading Strategy” is a medium short term trend following system.
That means the system takes advantage of short term small trends within the market.
- Best Time Frames: H1, H4, and Daily
- Recommended Currency Pairs: EURUSD, GBPUSD, GBPJPY, USDJPY, and All Currency Pairs

- Slope Direction Line Green color
- Triline 3 MTF +SigMA TT Green color histogram
- FX Trender bullish

- Slope Direction Line Red color
- Triline 3 MTF +SigMA TT Red color histogram
- FX Trender bearish
“Cut your losses short, but let your profits run on.”
Letting profits run isn’t really a trading strategy until an actual exit method is implemented.
- How long do you let it run for?…
- How do you know when it is no longer “running?”…
The easiest way to answer these questions is with a TRAILING STOP.
The amount of profit is determined by how far the price rose before reversing course and hitting the trailing stop order.
This “Forex Slope Direction Line Trend Following Trading” is an excellent strategy if you discipline to follow your rules and practice proper money management.
 Forex Stocks Crypto Trading Strategy Forex Strategies – Forex Resources – Forex Trading-free forex trading signals and FX Forecast


