FREE DOWNLOAD M15 Parabolic Sar Trading System – Successful Forex Parabolic Sar Trend Strength Momentum Trading System and Strategy. Although it is important to be able to identify new trends, it is equally important to be able to identify where a trend ends.
And your answer is Parabolic Sar.
One indicator that can help us determine where a trend might be ending is the Parabolic SAR (Stop And Reversal).
A Parabolic SAR places dots, or points, on a chart that indicate potential reversals in price movement.

From the image above, you can see that the dots shift from being below the candles during the uptrend to above the candles when the trend reverses into a downtrend.
This is probably the easiest indicator to interpret because it assumes that the price is either going up or down. With that said, this tool is best used in markets that are trending, and that have long rallies and downturns.
You don’t want to use this tool in a choppy market where the price movement is sideways.
The nice thing about this Forex M15 Parabolic Sar Trend Strength Momentum Trading System is that it is really simple to use. We mean REALLY simple.
Basically, when the Parabolic Sar dots are below the candles, it is a BUY signal.
When the Parabolic Sar dots are above the candles, it is a SELL signal.
Some may think why not just trade the dots. When it reverses, just make an entry at that price.
Technically you can trade like this and may win some, but this is a very risky way to trade this indicator. You need other tools to validate this potential trend.
Technically you can trade the Parabolic Sar like this and may win some, but this is a very risky way. You need other tools to validate this potential trend.
In this Forex M15 Parabolic Sar Trend Strength Momentum Trading System, we use Escalda, Momentum, Rune Trend, Mint Signal, and Exponential Moving Average to validate the potential trend.
This trend filter indicator is easy and simple to use. Basically, when Escalda dots (M1, M2, M3, M4) are Blue color, it is a BUY signal. And when the dots are Red color, it is a SELL signal.
BUY Signal
![]()
SELL Signal
![]()
From the image above, you can see that the Escalda dots will help you to catch the right trend after Parabolic Sar signal.
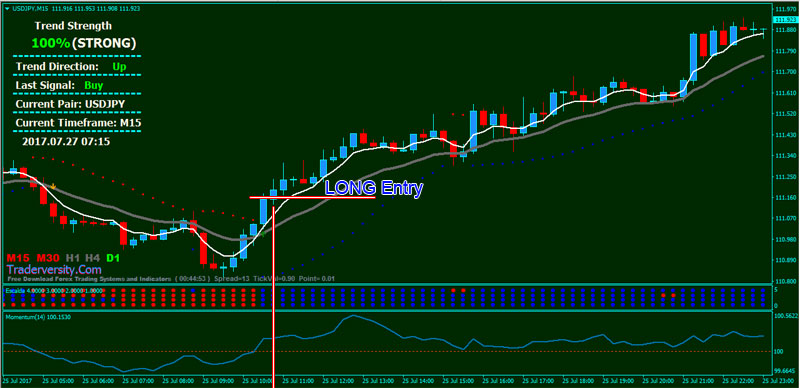
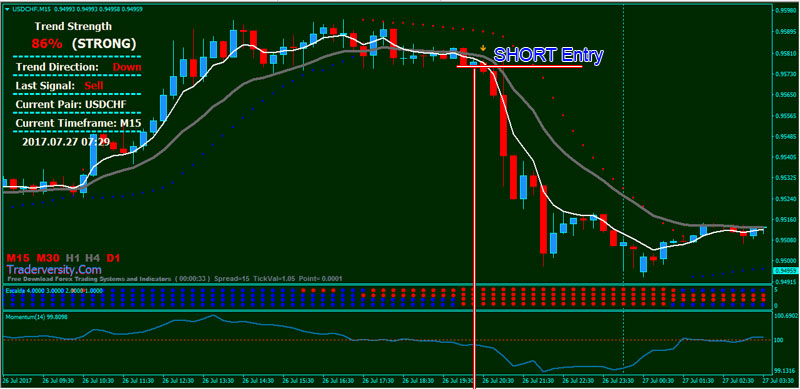
Now let me show the example of how to use Forex M15 Parabolic Sar Trend Strength Momentum Trading System.

- The Parabolic Sar dots are below the candles (Blue color)
- 5 EMA upward above 15 EMA
- Escalda dots (M1, M2, M3, M4) are Blue color
- Momentum line upward and above 100 level
- Rune Trend indicator strong BUY

- The Parabolic Sar dots are above the candles (Red color)
- 5 EMA downward below 15 EMA
- Escalda dots (M1, M2, M3, M4) are Red color
- Momentum line downward and below 100 level
- Rune Trend indicator strong SELL
Although it is important to be able to identify new trends, it is equally important to be able to identify where a trend ends.
You can also use Parabolic SAR to help you determine whether you should close your trade or not.
 Forex Stocks Crypto Trading Strategy Forex Strategies – Forex Resources – Forex Trading-free forex trading signals and FX Forecast


Thank for the indicators. I will try them out and get back to you. God bless you.