Bullish-Bearish Candlestick Pattern Trading – High accuracy low-risk Forex DeMarker CCI Bullish Bearish Price Action Trading Strategy for H4 and Daily time frame trading.
Over time, the candlesticks group into recognizable patterns that investors can use to make buying and selling decisions.
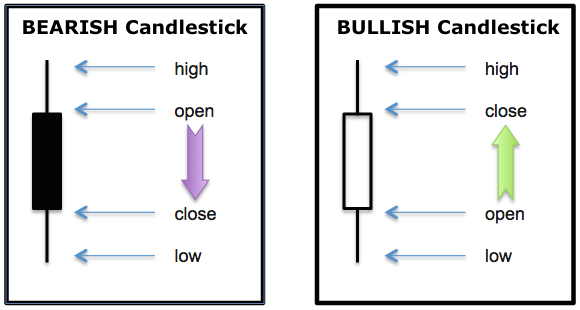
Each candlestick represents one day’s worth of price data about a stock through four pieces of information: the opening price, the closing price, the high price, and the low price.

The color of the central rectangle (called the real body) tells investors whether the opening price or the closing price was higher.
A BLACK or filled candlestick means the closing price for the period was less than the opening price; hence, it is bearish and indicates selling pressure.
Meanwhile, a WHITE or HOLLOW candlestick means that the closing price was greater than the opening price. This is bullish and shows buying pressure.
The lines at both ends of a candlestick are called shadows, and they show the entire range of price action for the day, from low to high.
The upper shadow shows the stock’s highest price for the day and the lower shadow shows the lowest price for the day.
In this article, we will focus on identifying BULLISH and BERISH candlestick patterns that signal a buying and selling opportunity.
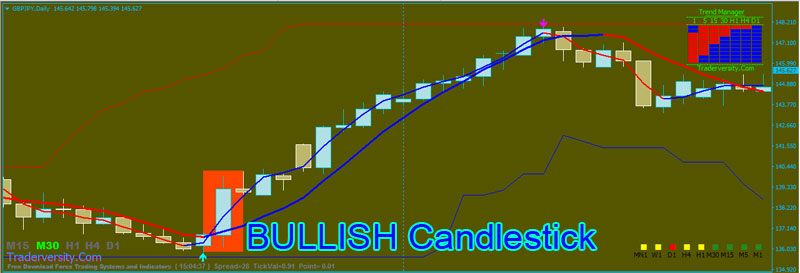
BULLISH Candlestick for BUY Signal

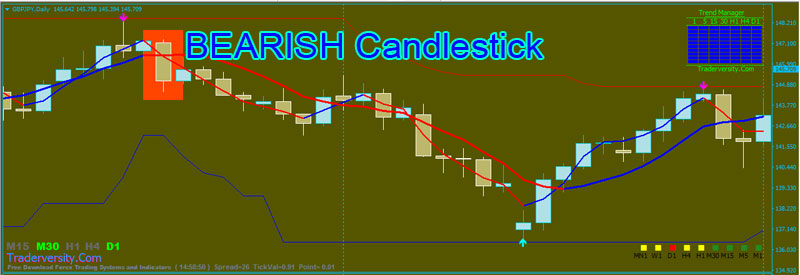
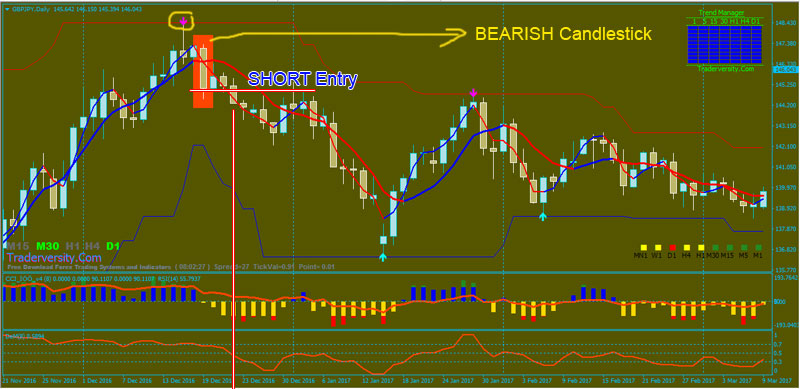
BEARISH Candlestick for SELL Signal

Candlestick patterns emerge because human actions and reactions are patterned and constantly replicate and are captured in the formation of the candles.
So,
by recognizing these patterns and applying the lessons that the patterns teach, can and does yield results in your trading!
Now I will show you how easy “Forex DeMarker CCI Bullish-Bearish Price Action Trading Strategy” is.

- Blue arrow Super Signals Channel below the previous swing
- BULLISH Candlestick
- Non-Lag 8 MA blue color and above Non-Lag 21 MA
- CCI NUF Blue color bars
- RSI (14) line upward and above 50 level
- DeMarker line upward above 0.5 level

- Magenta arrow Super Signals Channel above the previous swing
- BEARISH Candlestick
- Non-Lag 8 MA red color and below Non-Lag 21 MA
- CCI NUF Yellow color bars
- RSI (14) line downward and below 50 level
- DeMarker line downward below 0.5 level
For the most part, BULLISH-BEARISH Candlestick patterns are about spotting market turns, If you can spot a turn, then you can profit from it.
This “Forex DeMarker CCI Bullish-Bearish Price Action Trading” is an extremely high accuracy system. Remember, discipline is the key to your success.
 Forex Stocks Crypto Trading Strategy Forex Strategies – Forex Resources – Forex Trading-free forex trading signals and FX Forecast


