 Forex Stocks Crypto Trading Strategy Forex Strategies – Forex Resources – Forex Trading-free forex trading signals and FX Forecast

3x Semafor Trading Strategy with Smoothed Heiken Ashi and RSI Filter
Welcome to TraderVersity. In this tutorial, we’ll break down a powerful trading strategy that combines the 3x Semafor indicator, Smoothed Heiken Ashi, a Moving Average, and the RSI indicator to help filter high-probability trade setups.
When used correctly and with discipline, this strategy can help traders identify stronger BUY and SELL entries while avoiding lower-quality signals. The key is not just finding signals, but filtering them properly so you only take trades that meet the full trading rules.
In this guide, we’ll focus on how the strategy becomes more accurate and efficient when combined with an RSI overbought and oversold filter.
Why Add RSI to the 3x Semafor Trading Strategy?
The basic 3x Semafor strategy with Smoothed Heiken Ashi can already provide useful entry signals. However, not every signal has the same quality.
That is where the RSI indicator becomes valuable.
RSI, or Relative Strength Index, helps identify when the market is potentially overbought or oversold. By using RSI as an additional filter, we can avoid taking too many trades and focus only on setups with stronger reversal or continuation potential.
In this strategy:
- For SELL entries, we look for signals when RSI is in the overbought zone
- For BUY entries, we look for signals when RSI is in the oversold zone
- We confirm the trade when price breaks the Moving Average and RSI exits the extreme zone
This makes the trading strategy more selective, cleaner, and potentially more profitable.
SELL Entry Rules
Let’s begin with a SELL setup.
In this example, we are looking for high-probability SELL entries using the 3x Semafor strategy combined with Smoothed Heiken Ashi and RSI.
To take a SELL trade, the setup must pass four important steps.
Step 1: Confirm the Main Trend with Smoothed Heiken Ashi
The first step is to check the Smoothed Heiken Ashi indicator.
If the Smoothed Heiken Ashi candles are red, it means the market is currently in a bearish trend. When the market is bearish, we only look for SELL opportunities.

This helps us trade in the direction of the main market momentum instead of forcing trades against the trend.
So the first rule is simple:
Only look for SELL entries when Smoothed Heiken Ashi is red.
Step 2: Find a SELL Signal from the 3x Semafor Indicator
The second step is to wait for a SELL signal from the 3x Semafor indicator.
In this strategy, the SELL signal is shown by the yellow Semafor signal.

On the chart example, there are several yellow SELL signals. Without any additional filter, each of these could look like a potential entry. But taking every signal is not always the best approach.
That is why we continue to the next confirmation step.
Step 3: Wait for Price to Break Below the Moving Average
After the yellow 3x Semafor SELL signal appears, we wait for price to break below the yellow Moving Average line.
This break confirms that bearish momentum is starting to take control.

A basic SELL entry happens when:
- Smoothed Heiken Ashi is red
- A yellow 3x Semafor SELL signal appears
- Price breaks below the Moving Average
Even without using price action patterns, these entries can still produce profits. Some trades may generate small profits, while others may produce much larger moves.
But we can make the strategy even more efficient by adding the RSI filter.
Step 4: Use RSI Overbought as the Final SELL Filter
The final confirmation is the RSI.
For a stronger SELL entry, we only take trades when the RSI has reached the overbought zone, which is typically above the 70 level.

The best SELL confirmation happens when:
- RSI is in the overbought zone
- Price breaks below the Moving Average
- RSI crosses back below the 70 level
This means the market may be losing bullish strength and starting to shift bearish.
By applying this RSI filter, many lower-quality SELL signals are removed. Instead of taking every Semafor signal, we only focus on the strongest setups.
In the example, this filter reduced the number of SELL entries dramatically, but the remaining trades produced much larger profits.
That is the power of filtering your trades properly.
BUY Entry Rules
Now let’s look at the BUY setup.
The same logic applies, but in the opposite direction. For BUY trades, we want to trade with bullish momentum and use the RSI oversold zone as our filter.
Step 1: Confirm the Bullish Trend with Smoothed Heiken Ashi
First, check the Smoothed Heiken Ashi indicator.
If the Smoothed Heiken Ashi candles are lime green, it means the market is currently in a bullish trend.
When the market is bullish, we only look for BUY opportunities.
The first BUY rule is:
Only look for BUY entries when Smoothed Heiken Ashi is lime green.
This keeps your trades aligned with the main trend.
Step 2: Find a BUY Signal from the 3x Semafor Indicator
Next, wait for a BUY signal from the 3x Semafor indicator.
In this strategy, the BUY signal is shown by the blue Semafor signal.
On the chart example, there are two blue BUY signals. These signals show possible buying opportunities, but we still need confirmation before entering the trade.
Step 3: Wait for Price to Break Above the Moving Average
After the blue 3x Semafor BUY signal appears, wait for price to break above the yellow Moving Average line.
This break confirms that bullish momentum is returning.
A basic BUY entry happens when:
- Smoothed Heiken Ashi is lime green
- A blue 3x Semafor BUY signal appears
- Price breaks above the Moving Average
In the example, one BUY entry appeared after a strong bullish candle. This kind of confirmation can help show that buyers are entering the market with strength.
Step 4: Use RSI Oversold as the Final BUY Filter
The final step is to check the RSI.
For a higher-quality BUY entry, we only take trades when RSI has reached the oversold zone, usually below the 30 level.
The strongest BUY confirmation happens when:
- RSI is in the oversold zone
- Price breaks above the Moving Average
- RSI crosses back above the 30 level
This shows that bearish pressure may be weakening and bullish momentum may be starting to return.
By using this RSI oversold filter, the number of BUY entries becomes smaller, but the quality of the setup improves.

In the chart example, only one BUY signal passed the full filter, but it produced a strong and profitable move.
Complete Trading Rules Summary
Here is a simple summary of the full strategy.
SELL Setup
Look for a SELL trade when:
- Smoothed Heiken Ashi is red
- A yellow 3x Semafor SELL signal appears
- Price breaks below the Moving Average
- RSI is overbought and crosses below the 70 level
BUY Setup
Look for a BUY trade when:
- Smoothed Heiken Ashi is lime green
- A blue 3x Semafor BUY signal appears
- Price breaks above the Moving Average
- RSI is oversold and crosses above the 30 level
Why This Strategy Can Improve Trading Accuracy
The main advantage of this strategy is that it forces you to be selective.
Many traders lose money because they take too many trades or enter too early. This method helps solve that problem by using multiple layers of confirmation.
Each indicator has a specific role:
- Smoothed Heiken Ashi identifies the main trend
- 3x Semafor highlights potential reversal or entry zones
- Moving Average confirms momentum direction
- RSI filters entries based on overbought and oversold conditions
When all four conditions align, the trade setup becomes much stronger.
This does not mean every trade will win. No trading strategy is perfect. However, using this type of structured approach can help improve consistency and reduce emotional decision-making.
Final Thoughts
The 3x Semafor trading strategy becomes much more powerful when combined with Smoothed Heiken Ashi, a Moving Average, and the RSI filter.
Instead of entering every signal, you wait for the best setups:
- SELL when the market is bearish, RSI is overbought, and price breaks below the Moving Average
- BUY when the market is bullish, RSI is oversold, and price breaks above the Moving Average
This makes your trading more efficient because you take fewer trades, but the trades you do take have stronger confirmation.
You can also experiment with other filters or indicators that match your trading style. The most important thing is to follow your rules with discipline, manage risk properly, and test the strategy before using it on a live account.
Trading is not about taking every signal. It is about taking the right signals at the right time.
“NEW DONCHIAN CHANNEL”

High Accuracy Forex Donchian Channel Trading Strategy with Super Signals Channel Indicator. Donchian Channels has a simple plotting of highest high and lowest low of the last “n” periods.
The n periods is based on the trader’s choice, who can select the period according to their requirements ranging from a day, hour and minutes etc.
Read: High Accuracy Forex Simple Momentum Stochastic Oscillator Trading System
Traders use Donchian Channels to understand the support and resistance levels.
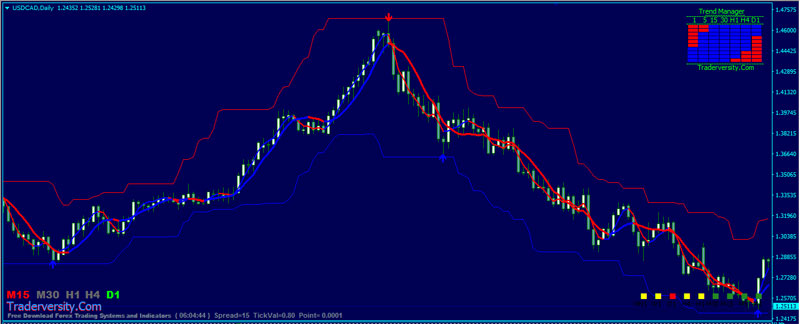
How to trade the market with Donchian Channel Trading Strategy with Super Signals Channel Indicator?…
Super Signals Channel Indicator is the main key in this trading system but we can’t use the indicator alone. We need confirmation indicators to catch high portability signals.
- Best Time Frames: M30, H1, H4, and Daily time frames
- Recommended Currency Pairs: EURUSD, GBPUSD, USDJPY, and all major pairs
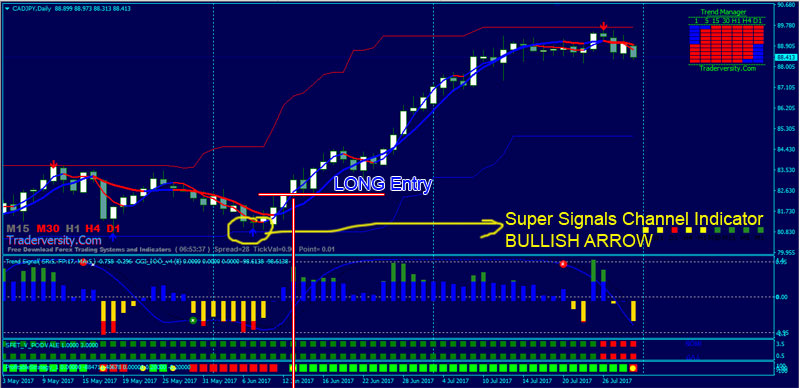
- Blue color BULLISH ARROW Super Signals Channel Indicator
- Non-Lag 10 MA Blue color and above Blue color Non-Lag 21 MA
- Trend Signal oscillator upward
- CCI NUF Blue color bars
- SFET V PODVALE Green color
- Profitable Strategy 1 Green Color
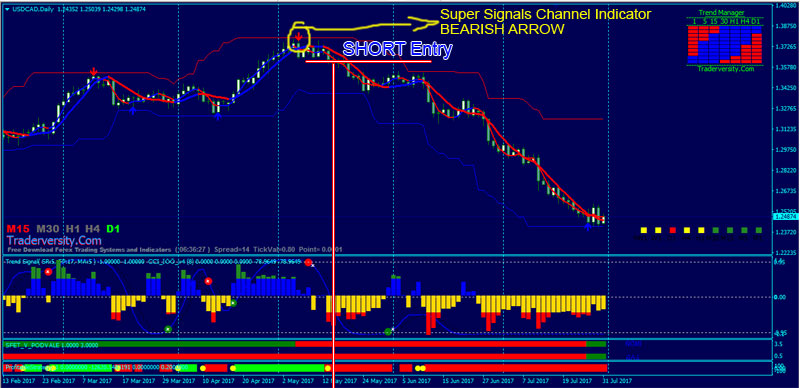
- Red color BEARISH ARROW Super Signals Channel Indicator
- Non-Lag 10 MA Red color and below Red color Non-Lag 21 MA
- Trend Signal oscillator downward
- CCI NUF Red color bars
- SFET V PODVALE Red color
- Profitable Strategy 1 Red Color
Placing stop loss is easy: Just Place your stops outside of the channel lines. But your stop loss should be determined by the timeframe you are trading in.
- If you are trading on 5-minute charts, place your stop loss 10-15pips outside of the channel line.
- If you are trading in 1hr or 4 hr charts, you stop loss should be 20-50pips outside of the channel line.
HOW DO YOU SET YOU TAKE PROFIT TARGETS?….
Set your take profits to 3 times the amount your risked: for example, if you stop loss is 20 pips then set your take profit target to 60pips.
Order Blocks Indicator in Forex & Stock Market…
What makes it so powerful is the way everything is displayed directly on your chart. Each zone appears as clean, color-coded rectangles complete with clear labels, allowing you to instantly understand what the market is telling you without spending extra time manually analyzing every price movement.
In simple terms, it helps you see where professional money may be positioning itself — making your trading decisions faster, clearer, and significantly more precise.

By using this powerful tool, you gain a much deeper understanding of overall market structure, allowing you to identify critical price zones where the market is most likely to either reverse direction or continue moving along its existing trend.
So the real question is…
Are you ready to start identifying these high-probability market zones and completely refine the way you trade?

- OB Candle Type Filter: Turn this on to filter order block candles based on direction. If it’s on, only bearish candles are valid for bullish order blocks, and only bullish candles are valid for bearish order blocks.
- Lifetime of OB (ZZ points): Set how long the order block lasts in ZigZag points. This means the order block will disappear once the specified number of ZigZag swings is reached.
- Display Order Blocks: Turn this on or off to show or hide specific types of order blocks.
- Extend Zones for n Candles: Choose how many candles the zones should extend.
- Zones Text Size: Adjust the size of the text for zone labels.
While order blocks alone may not signal trades, they are invaluable for confirming setups based on other signals. Combining this indicator with other ICT tools can enhance your trading strategy, offering a robust approach to market analysis.
The 4 Most Important Moving Average Trading Strategies You Must Master
If you want consistent results with a Moving Average trading strategy, you need more than just indicators on your chart. You need clarity. You need structure. And most importantly, you need rules you can follow with confidence.
In this strategy, you’ll master the four most important keys to trading with Moving Averages:
- How to identify a valid trending market
- The best timing to enter a trade with high probability
- The most profitable stop loss placement
- A smart target profit and exit strategy
When you apply these four principles with discipline, trading becomes simpler. You’ll clearly see when to enter, when to exit, and how to manage risk effectively—without getting lost in complicated theories or confusing analysis.
Let’s break it down step by step.
1. Identifying a Valid Trending Market

Your first and most important job as a trader is to find a market where:
- The trend is clearly visible
- The trend is strong
- The direction is readable
- The opportunity offers optimal profit relative to your risk
2. The Best Time to Enter a Trade (High Probability Timing)
What Makes a High-Probability Pullback?
The answer lies in the spacing between the Moving Averages.

A high-probability pullback occurs when:
- Price corrects and enters the space between the green and black Moving Averages.
- Price resumes upward movement.
- A bullish candle forms while the space between the Moving Averages remains intact.
- The blue Moving Average stays above the green Moving Averages.
When these conditions align, that’s your signal to enter a BUY position.
You are not chasing the market.
You are entering after a healthy correction in a confirmed trend.
That’s precision.
3. The Most Profitable Stop Loss Placement
Stop loss placement directly affects your risk-reward ratio and long-term profitability. In this strategy, there are three logical stop loss areas:
- Around the red Moving Average
- Around the black Moving Average
- Above the nearest swing high or below the nearest swing low

4. Target Profit and Exit Strategy

- Exit Model 1: Fixed Risk-Reward Ratio (1:2)
- Exit Model 2: Exit When Price Breaks the Red Moving Average
- Exit Model 3: Combination Strategy (Advanced)
 Forex Trading SPREAD and SWAP Monitor – MT4 Indicator
 FGF Trend Follow Zeron Trading System
 Forex Market “STRONG” Trend Momentum System
 Forex BBand Trend Magic “SCALPING & SWING” Trading System
 Forex & Bitcoin Latest Analysis (Jan 20-24 2020)
 Forex Aroon Up-Down with Alert MQ4 Trading Indicator
 Candlestick Pattern Scanner Dashboard MQ4 Indicator
 Forex & Stocks VSD Heiken Ashi “H1 Time Frame” Trading Indicators and Strategy (6907)
 (MARSI) RSI Trend MT4 MQL 4 Trading Indicator and Strategy
 Forex & Stocks Synergy TDI Trend Momentum Trading System (6868)


