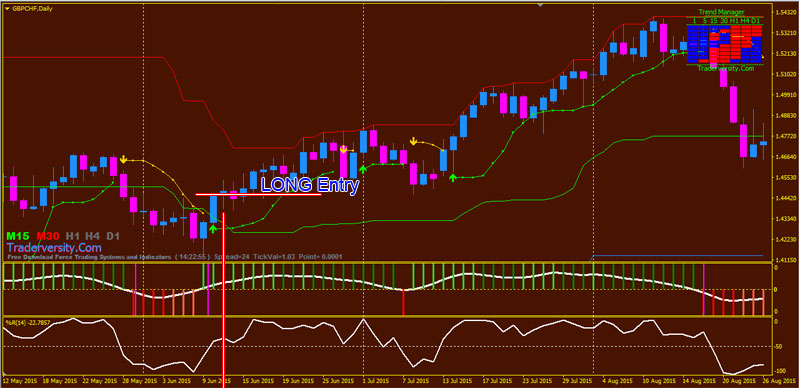
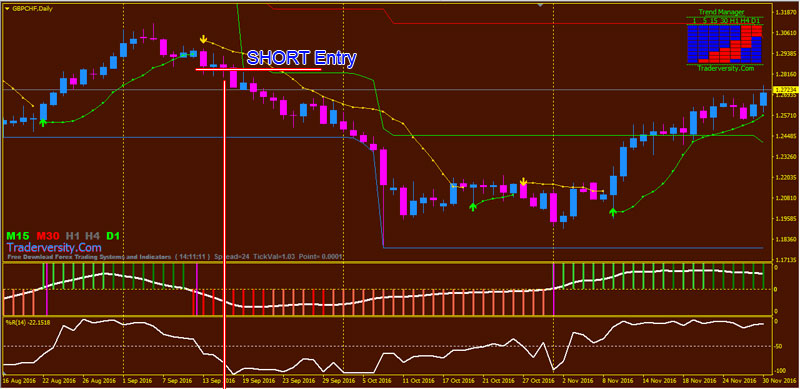
FREE DOWNLOAD Forex Trading Daily Time Frame with BBand Stops High Low Middle Trading Zone. This trading system works well on Daily time frame and major pairs.
The BBand Stops indicator – this custom version of Bollinger Band indicator is far simpler to trade with comparing to its original.
Using this indicator you will easily get to know in which trend type is the market and opening position is fairly easy following few simple rules, while books could be written around tens of various examples occurring when you use the original version.

I’ll try to keep it as simple as possible explaining to you how to trade with BBands Stops indicator. Read: Forex DeMarker CCI Bullish-Bearish Price Action Trading Strategy
This indicator clearly shows which trend I’m dealing with. When the blue dots lined is below the price – it’s an uptrend when the candles are below the red dots lined – it is a downtrend.
In my case, a trend started in the point [1] marked at the graph. This indicator starts the trend beginning with the Green arrow you can see just below the candle.
Now that it’s obvious I’m dealing with the uptrend, I aim to search for ideal spots to open position at.
In this trading tutorial, I will show you how to trade the market accurately with “BBand Stops High Low Middle Trading Zone Trading System“.
- The trading system works well on Daily and H4 time frames
- Recommended Currency Pairs: GPUSD, EURUSD, USDJPY, and all major pairs

- Price upward above Green color BBand Stops
- Price and Green color BBand Stops above Green middle line of i-HighLowMiddle indicator
- GRAALun line upward above 0 level
- Triline 3 MTF +SigMA TT indicator Green color
- Williams’ Percent Range upward line above 50 level
- Trend Manager Blue color bars
- Mint Signal Green color

- Price downward below Red color BBand Stops
- Price and Red color BBand Stops below Green middle line of i-HighLowMiddle indicator
- GRAALun line downward below 0 level
- Triline 3 MTF +SigMA TT indicator Red color
- Williams’ Percent Range downward line below 50 level
- Trend Manager Red color bars
- Mint Signal Red color
Using this BBand Stops indicator is fairly dangerous for beginners especially at Forex market.
It’s true that Bollinger Bands is never used alone but in combination with technical analysis. The indicators can be very confusing for beginners but I hope this “BBand Stops High Low Middle Trading Zone Trading System” is a good solution for you.
 Forex Stocks Crypto Trading Strategy Forex Strategies – Forex Resources – Forex Trading-free forex trading signals and FX Forecast


