 Forex Stocks Crypto Trading Strategy Forex Strategies – Forex Resources – Forex Trading-free forex trading signals and FX Forecast

FREE DOWNLOAD High Profits trading system – Simple Winning Stochastic & MACD Forex Analysis and Forecast with 1:3 Risk Reward Ratio. This is Super Momentum trading system to get maximum profits.
The system is highly effective on any currency pair.
Besides, it is very flexible as any trader with some trading experience can extend the terms of opening and/or closing orders. It may help you to increase the obtained profit.
Thus, the system can be used by the trader with any qualification.
Stochastic Oscillator (in this trading system we use Super STOCH indicator) is a powerful indicator to follow trending market. It’s also a great indicator to get into new position when we’re not already in- continuation trade setup.
We cannot use stochastic to fight trending market.
When the price is moving between 20 and 80 we just have to stay away.
This is because no one can determine the direction of the movement.
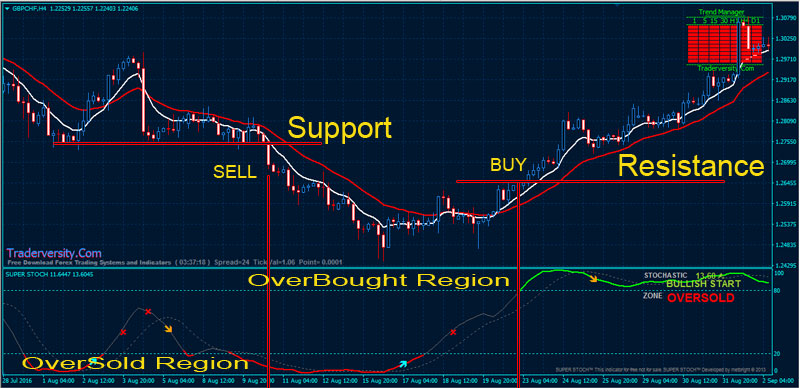
- For BULLISH trade, when the price gets to the overbought region, above 80 level, if a visible resistance is broken while stochastic is still on overbought then we have a GREAT BULLISH TRADE setup.
- Then for BEARISH trade when stochastic gets to the oversold region, below 20 level, and any visible support is broken while stochastic is still in the oversold region, then we have a GREAT BEARISH TRADE setup.
It doesn’t need too much explanation.
MACD (in this trading system we use Super MACD indicator) – How the name of the indicator was born.
The histogram is just a diagram that shows the difference between the quick and slow moving average. Looking at the original chart, you can see that, the histogram gets bigger, as the two moving averages separated.
This is called divergence because the faster/quicker moving average is “DIVERGING” or moving away from the slower moving average.
While the moving averages get nearer to each other, the histogram gets smaller. This is called convergence because the faster moving average is “CONVERGING” or coming together or getting closer to the slower moving average.
And that is how MACD was born – Moving Average Convergence Divergence!
MACD can be pronounced as either “Mac-Dee” or “M-A-C-D”.
There are two moving averages with different “speeds”; the faster one will obviously be quicker to react to price movement than the slower one.
When a new trend takes place, the quick line will react first and ultimately cross the slower line. When this “crossover” happens, the fast line begins to “diverge” or else travels away from the slower line, it repeatedly points out that a new trend has formed.

From the chart on the right, you can see that the fast line crossed beneath the slow line and correctly called a new uptrend.
Notice that when the lines crossed, the histogram temporarily fades away. This is because the variation between the lines at the time of the cross is 0.
As the downtrend starts and the fast line diverges away from the slow line, the histogram gets bigger, which is an excellent indication of a STRONG TREND.
This is a simple winning Stochastic MACD Forex analysis and forecast with 1:3 risk reward ratio. It’s a simple momentum strategy based on two advanced visual indicators: Super MACD and Super STOCH.
You can integrate these indicators with your trading favorite MetaTrader trading indicators.
The best performance of this strategy is for the medium range market or market trend.
- Best Time Frames: H1, H4, and Daily
- Recommended Currency Pairs: All Major Pairs
- Download “Traderversity.Com-SuperSTOCHMACD” (Zip/RAR File).
- Copy mq4 and ex4 files to your Metatrader Directory …/experts/indicators/
- Copy the “Traderversity.Com-SuperSTOCHMACD.tpl” file (template) to your Metatrader Directory …/templates /
- Start or restart your Metatrader Client.
- Select Chart and Timeframe where you want to test your forex system.
- Right-click on your trading chart and hover on “Template”.
- Move right to select “Traderversity.Com-SuperSTOCHMACD” trading system and strategy
- You will see “Slope Direction Line Trading System with OC Momentum Retracement OP Strategy” is available on your Chart

- Super STOCH gets to the overbought region, above 80 level (strong bullish)
- Super MACD strong UpTrend
- SFET V PODVALE indicator Green color
- 8 EMA (White line) upward above 21 EMA (Red line)
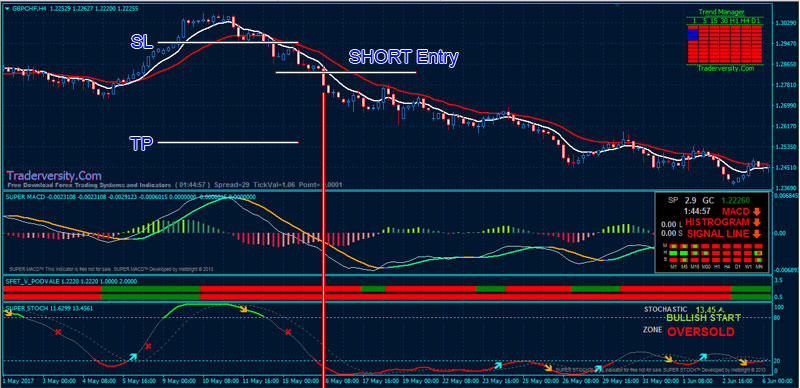
- Super STOCH gets to the oversold region, below 20 level (strong bearish)
- Super MACD strong DownTrend
- SFET V PODVALE indicator Red color
- 8 EMA (White line) downward below 21 EMA (Red line)
- Initial Stop Loss above previous swing high or below previous swing low.
- Stop Loss Take Profit Ratio = 1:3
- The best performance of this “Traderversity Simple Winning Super STOCH & Super MACD Trading” strategy is for the medium range market or market trend.
- Use Higher Time Frames And Trend Direction To Filter Trades.
DOWNLOAD TRADING SYSTEM [/sociallocker]
 Profitable Trading Strategy Using MACD (12 26 9) and Heiken Ashi MA (20)
 Trend Session MACD Double Histogram Trading System with Parabolic Indicator
 Forex FS30 “BEST” Trading System for H4 Time Frame Chart
 Forex and Stocks “RSI-MACD-STOCHASTIC” Trading Strategy
 Extremely High Accuracy Accelerator Oscillator Trading Strategy with Price Borders
 Zig Zag EXIT Indicator
 Forex Standard Deviation Channel – MetaTrader 4 Indicator
 Forex Super Signal Channel Trading System & Strategy
 Forex Trend Scalp MT4 Trading Indicator and Template
 Forex Color “MA-Channel” Trading System & Strategy


