The Best and Most Trusted Forex SWING Trading System and Strategy. Interested in knowing what are the best forex trading strategies to increase your potential of becoming successful?…
In this article, I’m going to show you RSI Prognoz Trading Channel System – The Great Forex Swing Trading Strategy for H4 and Daily Time Frames.
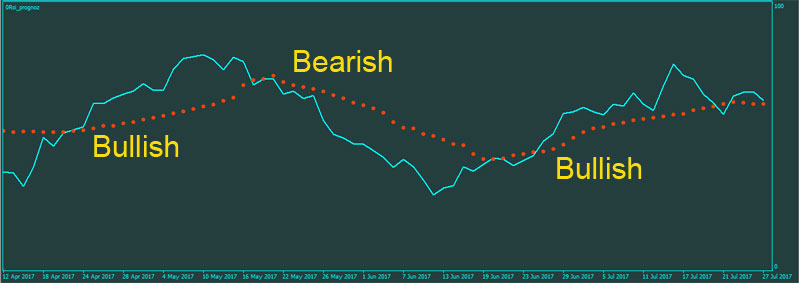
RSI Prognoz Indicator is easy to use to catch the market trend and reversal. When Aqua line upward and above Orange dots, it can be the indication of a Bullish market. When Aqua line downward and below Orange dots, it can be the indication of a Bearish market.
RSI Prognoz Indicator Settings:
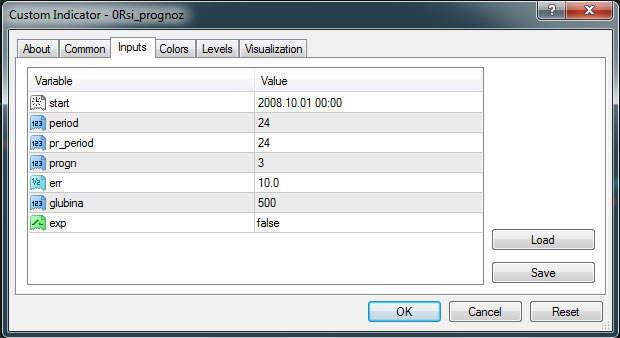
- Start: start date for indicator calculation
- Period: a period of the predicted RSI
- PR_Period: cluster size in bars
- Progn: number of bars for the prediction
- Err: error threshold for the cluster, at which the cluster is considered (from 0 to 100)
- Glubina: depth to search for suitable clusters (0-entire array)
- Exp: averaging mode of the prediction based on found clusters (0-simple moving average, 1 – linearly-weighted moving average)
The idea was simple: take the history values of RSI over pr_period bars and see the indicator values after progn bars, i.e. obtain a set of indicator values and a pseudo-value of what this set resulted in, store everything to an array.
Then iterate over the array at a specified glubina depth and see if there had been any similar situations (satisfying err error) in the past and what they had lead to.
The obtained results are averaged using the exp method.
This concludes the calculation of the prediction.
The FXPASS Channels is an indicator which captures the highest high and the lowest low over the past X periods.
The FXPASS Channels are frequently used as a breakout timing tool. For example, if a trader is looking to capture a bullish breakout on a 4-hour candle chart, they are essentially waiting for the market to dictate when it is ready to trade at new 55 candle highs.
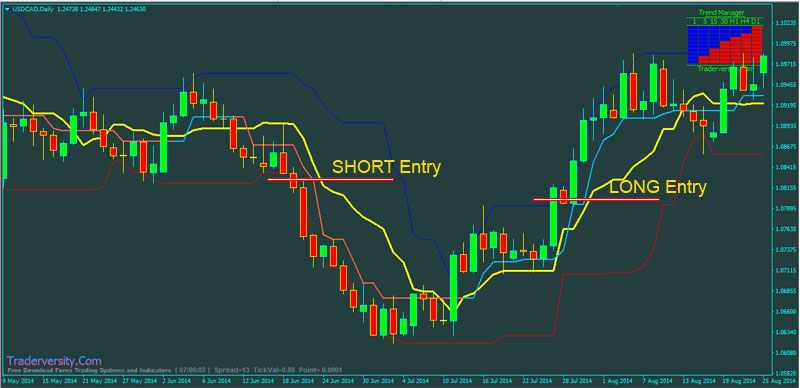
The entry and exit of the strategy are simple.
- Wait for a Candle to Close above the upper channel.
- Set the stop loss at the lower FXPASS Channel.
- The stop loss is manually trailed at the lower channel until the stop loss is triggered. If we remain in this trade long enough, then eventually, the stop loss will get moved to break even and possibly higher.
RSI Prognoz Trading Channel is Forex Trading Strategy for H4 and Daily Time Frames. Yes, you can use the trading system on smaller time frames but the best time frames are H4 and Daily.
- Best Time Frames: H4 and Daily (Short term swing trading)
- Most Recommended Currency Pairs: GBPJPY, USDCAD, GBPCHF, EURUSD, GBPUSD, and all Major Pairs
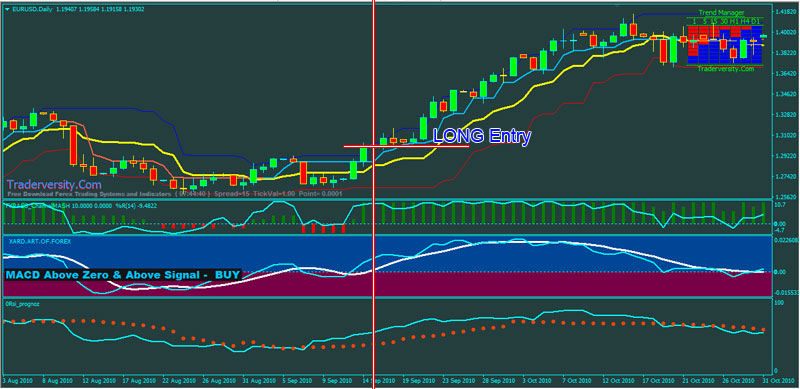
- Aqua line RSI Prognoz indicator upward and above Orange dots (BULLISH)
- Price rises above FXPASS Channels
- MACD Line above 0 level and above signal – BUY
- FXPASS Channels MASH Green color histogram
- Williams’ Percent Range above 0 level
- HalfTrend Blue color line
- Trend Manager Blue color bars
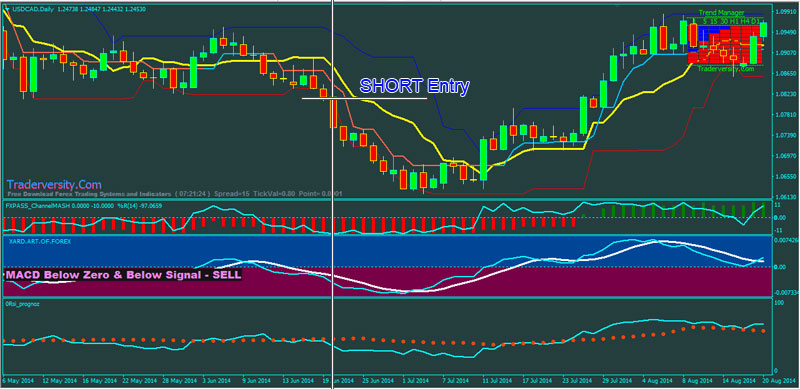
- Aqua line RSI Prognoz indicator downward and below Orange dots
- Price falls below FXPASS Channels
- MACD Line below 0 level and below signal – SELL
- FXPASS Channels MASH Red color histogram
- Williams’ Percent Range below 0 level
- HalfTrend Red color line
- Trend Manager Red color bars
RSI Prognoz Trading Channel is a very powerful trading system to develop the Trend following systems. It works extremely well in Trending markets both in the Intraday and Daily timeframe.
 Forex Stocks Crypto Trading Strategy Forex Strategies – Forex Resources – Forex Trading-free forex trading signals and FX Forecast


does any of the indicator repaint?