 Forex Stocks Crypto Trading Strategy Forex Strategies – Forex Resources – Forex Trading-free forex trading signals and FX Forecast

Super Easy and High Profits Forex Williams %R Momentum with “Support Resistance BreakOut” Trading Strategy. Making money through Forex trading is not as hard and complicated as what novice traders think.
Williams’ Percent Range or Williams’ %R is very similar to the Stochastic Oscillator. The only difference is that %R has an upside down the scale and the Stochastic Oscillator has internal smoothing.
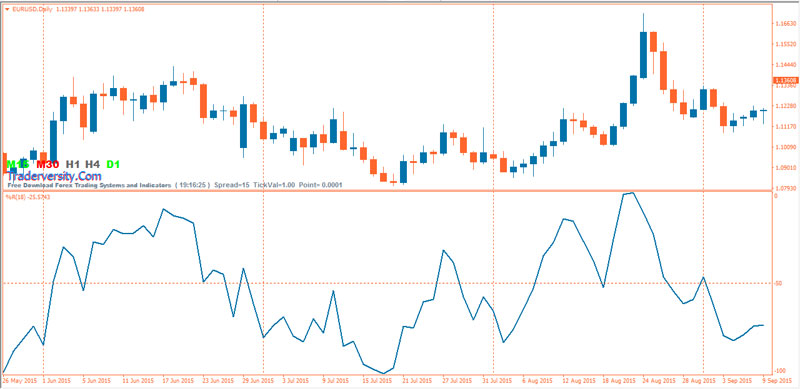
Williams’ Percent Range or Williams’ %R -50 level can be used as a strong tool to confirm the different kinds of trade setups from any trading system.
Whether you use the candlestick patterns, support/resistance breakout, or any other trading system, you can consult the Williams’ %R -50 level to confirm your trade setups.
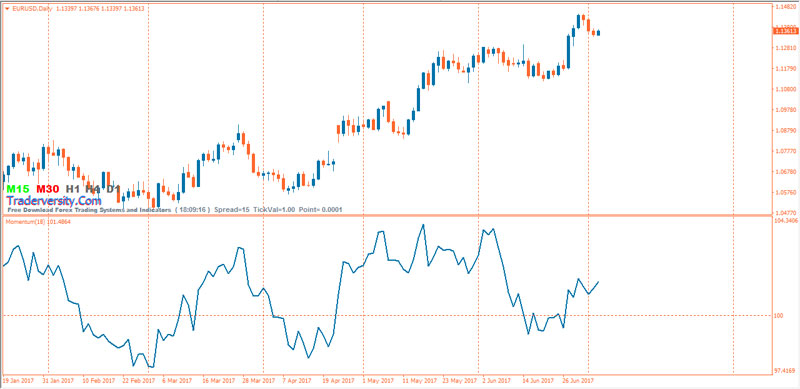
The Momentum indicator is classified as an “oscillator” since the resulting curve fluctuates between values about a “100” centerline, which may or may not, is drawn on the indicator chart.
100 Level Cross – When the price crosses above or below the 100 level (or zero line if the indicator is based on the first calculation) it can represent a BUY or SELL signal respectively.
- If the price crosses above the 100 level, it indicates the price is starting to move higher since the price has moved above the price “n” periods ago.
- When the price drop below the 100 level, it shows the price is dropping since it has moved below the price “n” periods ago.
On the small periods and during unstable volatility its signals, in general, cannot be trusted to as its line is redrawn and the previous signals are canceled.
This pulse indicator is the excellent sensor of the market force, but it is necessary to use it carefully.
In spite of the fact that there is only one parameter, it is recommended to select it carefully for the current volatility of an asset and it is obligatory to test it on historical quotations in Momentum Forex trading.
The best way to identify the target price is to identify the support and the resistance points.
The support and resistance (S&R) are specific price points on a chart which are expected to attract the maximum amount of either buying or selling.
The support price is a price at which one can expect more buyers than sellers. Likewise, the resistance price is a price at which one can expect more sellers than buyers.
As the name suggests, the support is something that prevents the price from falling further.
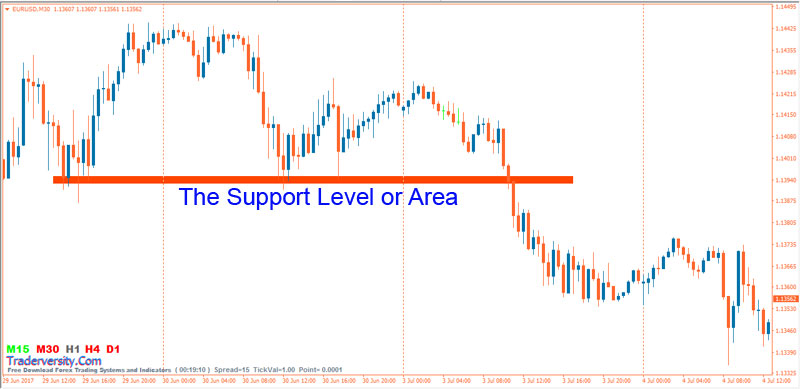
The support level is a price point on the chart where the trader expects maximum demand (in terms of buying) coming into the market.
Whenever the price falls to the support line, it is likely to bounce back. The support level is always below the current market price.
As the name suggests, resistance is something which stops the price from rising further.

The resistance level is a price point on the chart where traders expect maximum supply (in terms of selling) for the market. The resistance level is always above the current market price.
“Support and resistance” is common jargon for areas on the chart where the price has a difficult time breaking through. Support levels tend to stop price from falling below a specific point and resistance levels act like a price ceiling that price cannot break above. Knowing where these levels
Support levels tend to stop price from falling below a specific point and resistance levels act like a price ceiling that price cannot break above. Knowing where these levels
Knowing where these “Support and resistance” levels make it much easier to decide when to open and close trades, but how can we locate these prices, to begin with?
Today we will show you the simple ways to identify support and resistance in Forex, and how to trade the market using Forex Williams %R Momentum with Support Resistance BreakOut Trading Strategy.

- Price BreakOut above the resistance area and above 18EMA
- William’s Percent Range line upward above -50 level
- Momentum line upward above 100 level
- Mint Signal green color

- Price BreakOut below the support area and below 18EMA
- William’s Percent Range line downward below -50 level
- Momentum line downward below 100 level
- Mint Signal Red color
The momentum and William’s Percent Range indicators aren’t going to give a trader much information over and above what can be seen just by looking at the price chart itself.
If the price is moving aggressively higher, this will be visible clearly on the price chart, on the momentum indicator and William’s Percent Range indicator.
The momentum and William’s Percent Range indicators are best used in conjunction with a price action trading strategy (ex. Support Resistance BreakOut), providing confirmation as opposed to using the indicator to generate trade signals on its own.
 Forex/Stocks 18 “MULTI STOCHASTIC” Lines System
 Forex GTM GoldenFinger H1 Time Frame Trading System
 Forex KG FI Trading System with BBand Stop Buzzer Line and CCI Signals
 THE TURTLE TRADING: Forex MPC “Donchian Channel” Trading Strategy
 High Accuracy Forex Wildan RSI Trend System
 The EASIEST Way to Profit with Fractals (No Experience Needed!)
 Forex/Stocks VAR-MA Solar Wind MT4 Trading Indicator and Strategy
![Forex Wave Arrows Stochastic Oscillator Trading System [6630]](https://traderversity.com/wp-content/uploads/2019/01/Forex-Wave-Arrows-Stochastic-Oscillator-Trading-System-150x150.jpg) Forex Wave Arrows Stochastic Oscillator Trading System [6630]
Forex Wave Arrows Stochastic Oscillator Trading System [6630] Forex Market Way MT4 Trading Indicator and Template
 Forex Stochastic MTF with Alert MT4 MQ4 Trading Indicator & Template


