Trading fractals Bill Williams system really works – Forex High/Low Fractals with RSI Trend Momentum Trading System.

- DOWNLOAD these NON-REPAINT Tools For Making The Perfect Trade Entry (the best trading tools all traders MUST HAVE)
- Use a demo account or a small live account first to practice this trading system
This is a high profits Trading System using fractals profitably. The concept of The Forex Fractal is more than just a strategy idea. The fractal defines an area being watched by large numbers of Big Dog forex traders.
Fractals are indicators on candlestick charts that identify reversal points in the market.
Traders often use fractals to get an idea about the direction in which the price will develop. A fractal will form when a particular price pattern happens on a chart.
The pattern itself comprises five candles and the pattern indicates where the price has struggled to go higher, in which case an up fractal appears or lower, in which case a down fractal appears.
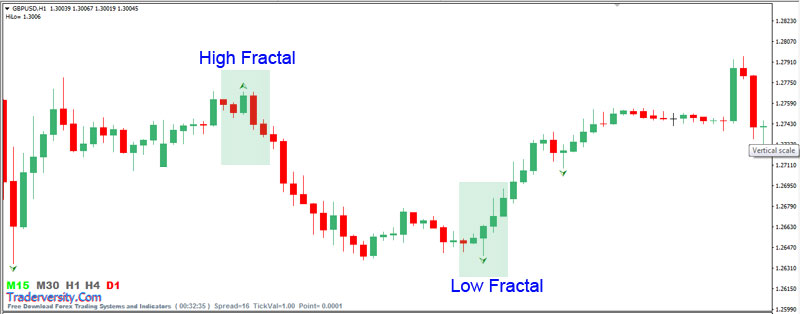
The chart below shows what fractal indicators look like on a chart:

A “High Fractal” formed when a candle has two candles to the right of it with two lower highs and at least two candles to the left of it with two further lower highs.
A “Low Fractal” is formed when a candle has two candles to the right with higher lows and two candles to left with two further higher lows.
The following chart shows what this pattern looks like:

Fractal indicators can be used to determine the market direction. Traders can use fractal indicators to determine the possible direction of price in a market.
RSI 50 level can be used as a strong tool to confirm the different kinds of trade setups from any trading system.
Whether you use the candlestick patterns, support/resistance breakout, or any other trading system, you can consult the RSI 50 level to confirm your trade setups.
Related RSI 50 Level Trading System: Bullish/Bearish Pin Bar Candlestick Patterns Trading with RSI
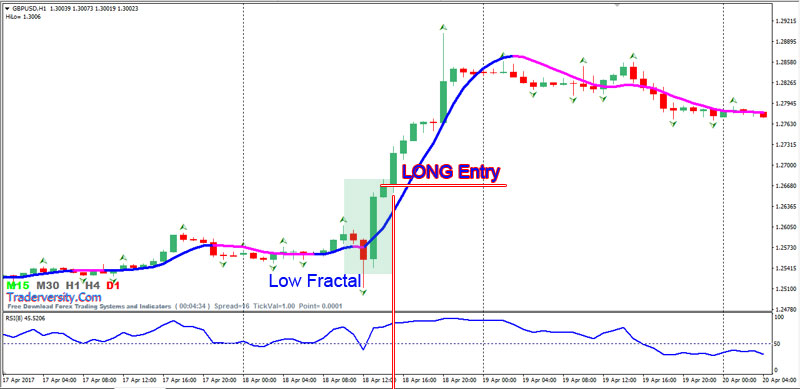
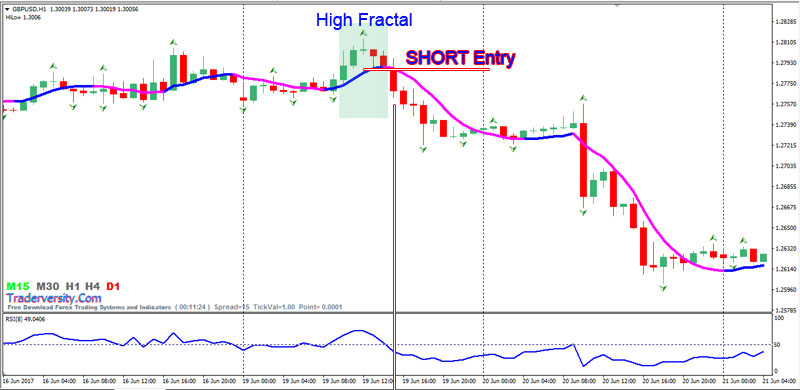
Let me show you the examples of High/Low Fractals with RSI Trend Momentum.

- RSI line upward above 50 level
- NonLag MA 21 upward and blue color
- LOW FRACTAL
- Mint Signal Green color

- RSI line downward below 50 level
- NonLag MA 21 downward and red color
- HIGH FRACTAL
- Mint Signal Red color
- For GBP-USD or EUR-USD H1 TimeFrame Trading: Your target is 350 pips. You can also try to use a trailing stop order to maximize your profit.
- Stop loss needs to be placed above or below the second candle:
- If you BUYP place a stop 5 pip below the 2nd candle
- If you SELL – place a stop 5 pip above the 2nd candle
 Forex Stocks Crypto Trading Strategy Forex Strategies – Forex Resources – Forex Trading-free forex trading signals and FX Forecast


